| Nikkei 225 NASDAQ | ||
|---|---|---|
  |
||
|
||
|
|
| Nikkei 225 NASDAQ | ||
|---|---|---|
|
||
|
||
|
|
US Treasury Public Debt RESOURCES Dismal
Scientist |
Quotes, Charts & Reports Annual
Report Links STATISTICS Argentina
|
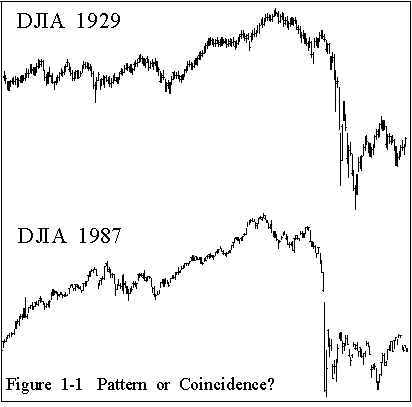
Equity Markets - Relations between the 1929 & 1987 crashes and present risks.
DOW JONES ichimoku
Dow Jones Indu.
Nikkei 225 Index
Pretty bad...Here are some statistics to put it all in perspective:
|
- Wall Street Journal, 9/4/29 Dow Diaries: The 5 one day bigger moves The
biggest was the historic crash that brought the industrials down
22.61% on Oct. 19, 1987. Among the causes of the 1987 crash were
rising interest rates, the U.S. bombing of Iranian oil platforms,
friction with U.S. trading partners, rampant speculation in the
futures markets, and loss of investor confidence after the Dow
industrials skidded in September and early October.
AND GOLD FUND INDEX DAILY
|
|||||||
Chronology: Fed
Policy Changes |
| Trading Charts | Commodity| Decision Point | Economic Charts| Futures Charting | Silicon Investor | Trade Signals | Euro-Capital | PC Quote | Prophet | Quote Watch | Stock Charts | Option Volatility Analysis | Dynex Corp. | Stock Market Model Data | |
|
|
Design and
Content Copyright © 1999-2001
Igor Waltritsch. All Rights Reserved. and are rapresenting a quality selection based purely on my opinions and ideas.. |